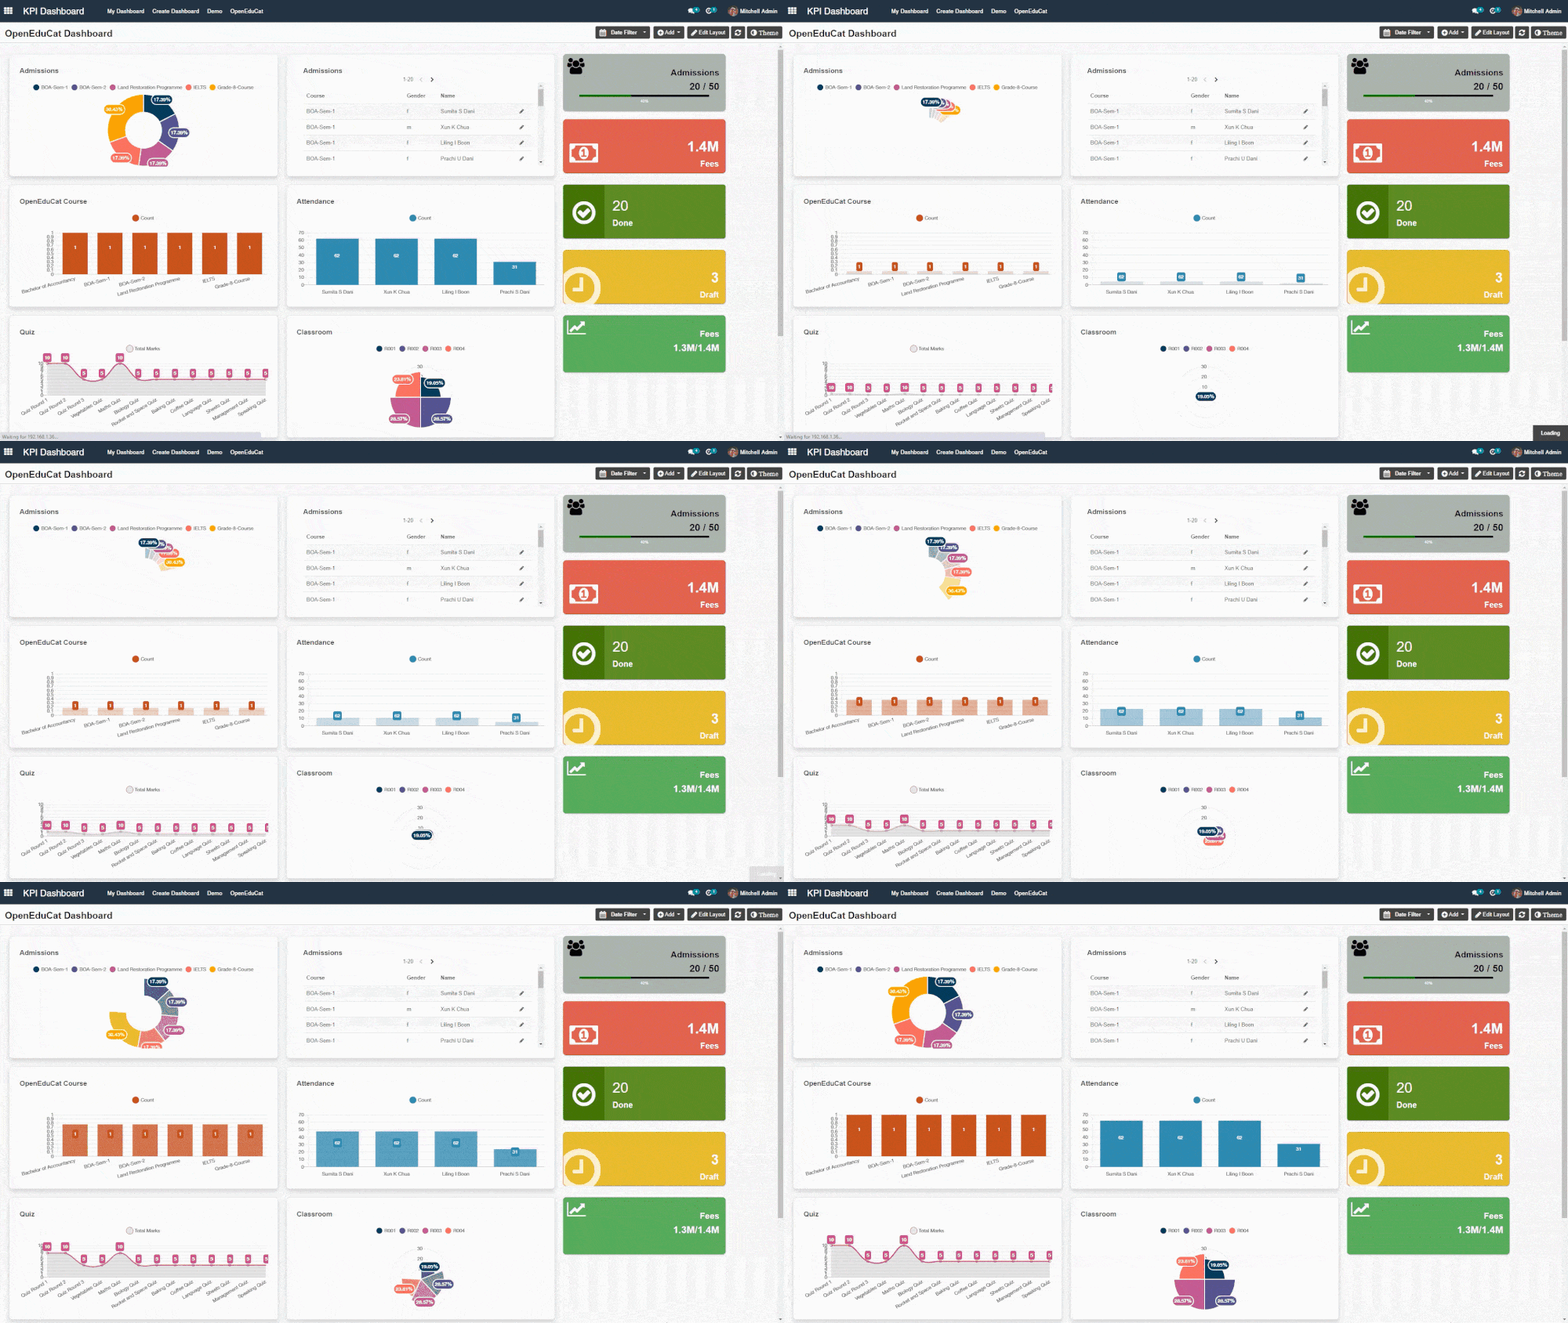
KPI Dashboards Home / Dashboards
Monitor all your department from a real-time Dashboard. It is a simple yet attractive and effective tool that allows users to a comprehensive overview of the health of the business or organization without spending long precious hours. Track your teams and their information on one screen with the help of KPI Dashboard. You can take an important decision regarding your business by looking at one glance.
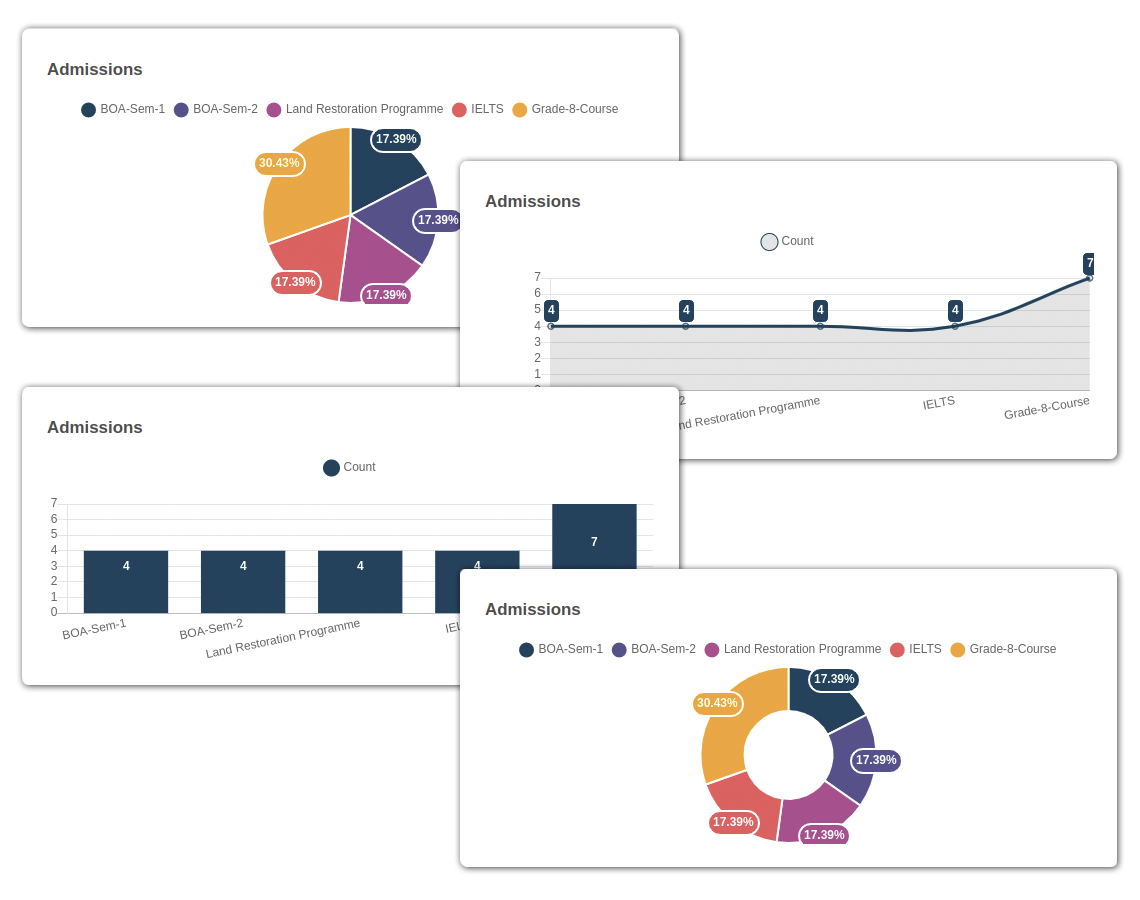
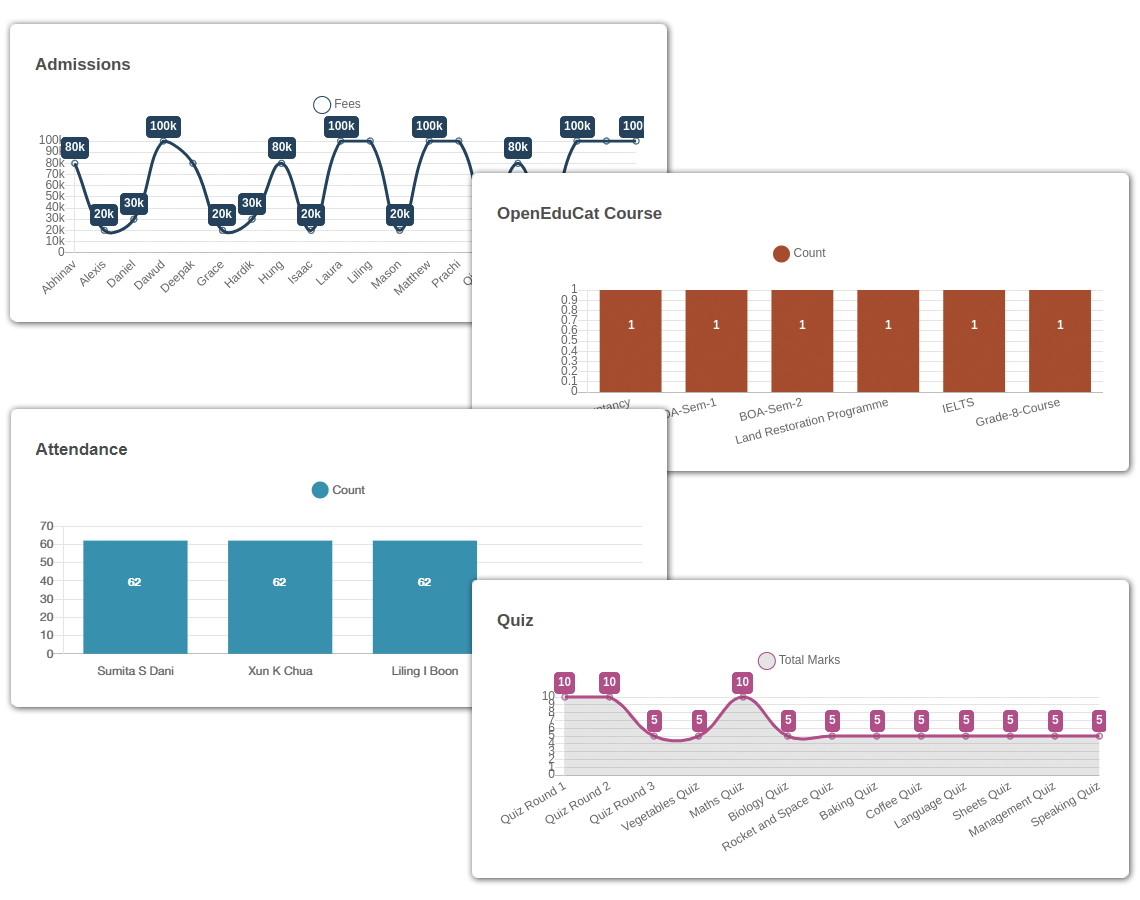
Representation of Data in a Different Chart
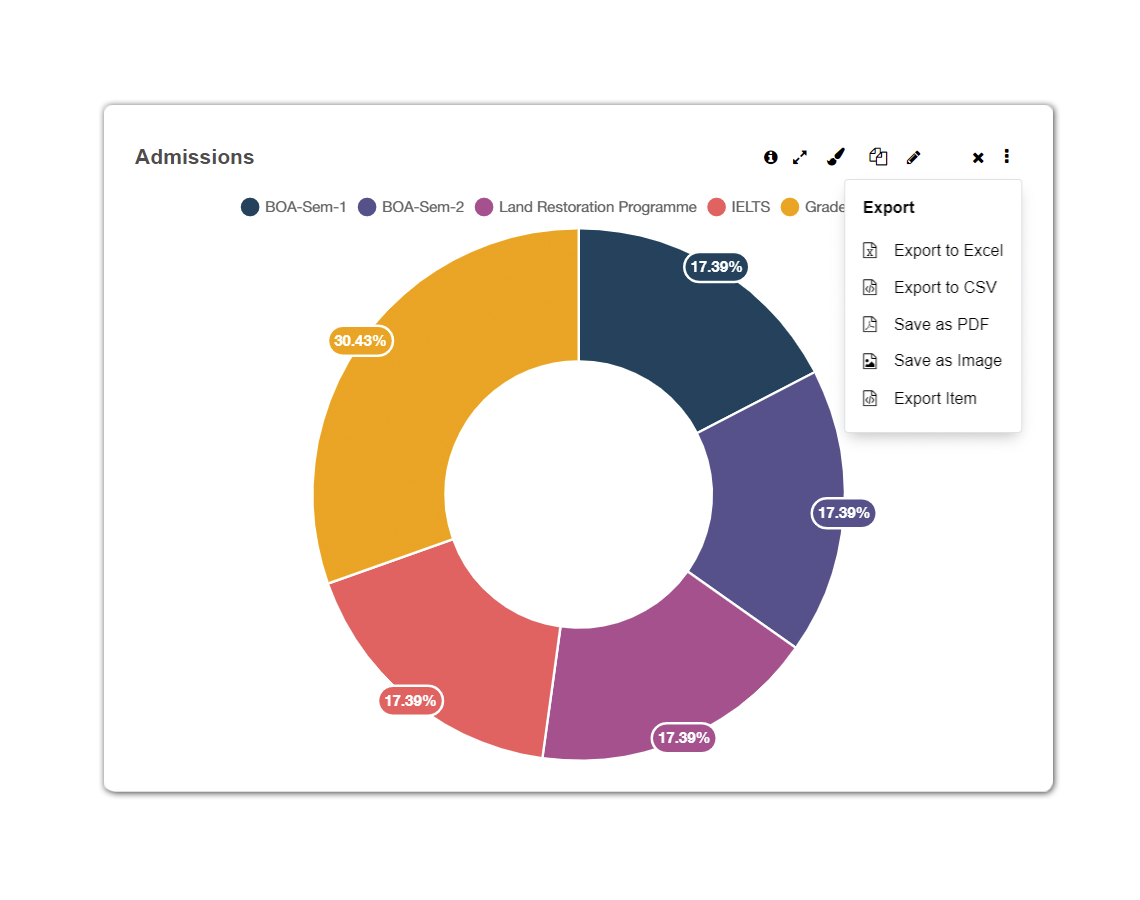
There are various types of graphical representations to showcase the raw data in KPI Dashboard . Those 8 types of charts are Line chart (Simple, Compound, Multiple), Bar Chart( Vertical, Horizontal, Slacked), Pie Charts(2D, 3D), Doughnut Chart, Area Chart, Polar area Chart, ListView. Target feature provided to set the target as line /bar and other graphical representations.
Track KPI Metrics
Enable business to take corrective actions to address any issues. Monitor KPI's identify new opportunities and improve your sales and marketing performances with KPI Dashboard.
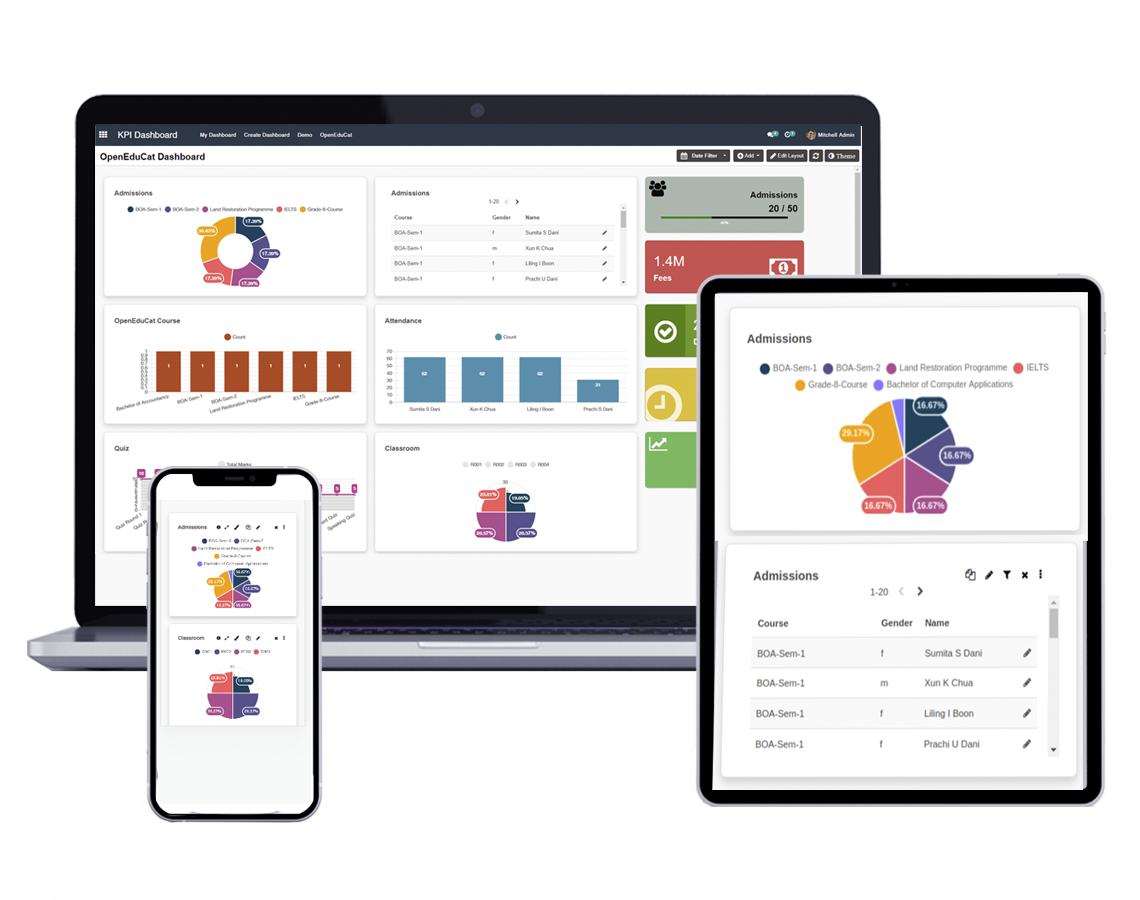
Appropriate Design for Different Devices
In KPI Dashboard Design should be made in such a way that it should be responsive to different device users such as Desktop, Tablet, and Mobile Phones.
Predefined Dashboard Layout Templates
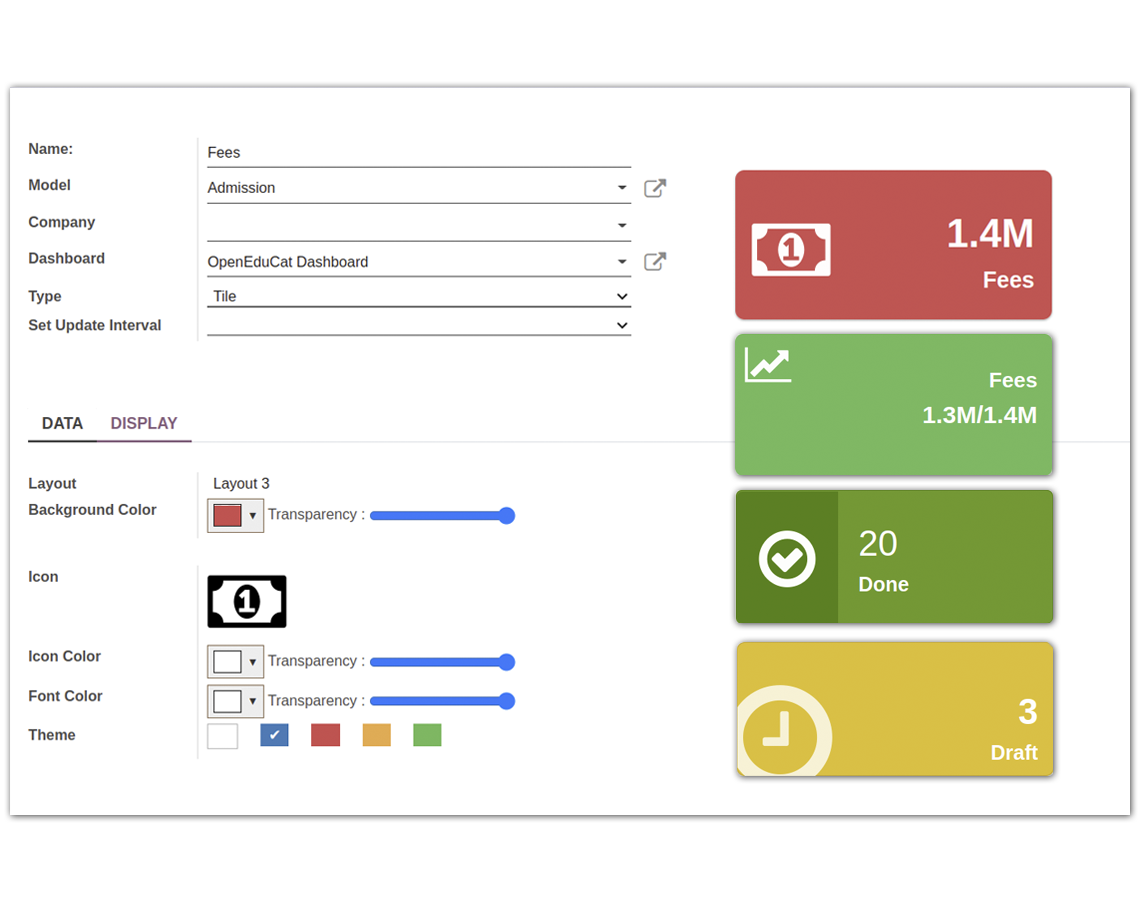
Various styles of templates are available. According to your taste, you can choose your templates. Any graphical representation color can also be changed quickly.
Export and Import Complete Dashboard Between Different Databases
As KPI Dashboard data are raw data of the organization so these can be transferred to the various database according to its use. Export any chart into Excel, PDF, PNG.
Refresh Dashboard Data Automatically
Data can be refreshed automatically with a configured time such as a particular interval of seconds, minutes. Also, date filter options are available whatever requirement of backdating data it can be availed here like 7 days, 30 days, 90 days, and so on.
